⚡ Week 14: Interface & Application Programming
FAB ACADEMY | ESP32 | LSM6DS33 IMU | PYTHON · FASTAPI · MQTT · WEBSOCKETS
Intro
This week's group assignment was to explore and compare various software tools for building user interfaces that interact with microcontrollers. On the individual side, the goal was to build a working interface that talks to a physical input or output device — and actually understand every layer of how the data gets there.
Rather than taking the easy route of an ESP32 serving a pre-built webpage, I built the full stack from scratch. An ESP32 reads a LSM6DS33 IMU sensor over I2C and streams 6 channels of live motion data — accelerometer and gyroscope on X, Y and Z — over USB serial at 50Hz. A Python backend running FastAPI picks that up, parses it, and pushes it over WebSocket to any connected browser. The browser dashboard is a plain HTML + JavaScript page with live scrolling charts for all 6 axes and buttons that send commands back down through the same stack to the ESP32.
| Layer | Technology | What it does |
|---|---|---|
| Sensor → MCU | I2C | LSM6DS33 sends readings to ESP32 over I2C at address 0x6A |
| MCU → laptop | Serial | ESP32 sends CSV lines over USB at 115200 baud |
| Laptop → browser | WebSocket | FastAPI pushes JSON to the browser as data arrives — no polling |
| Browser | JS | Vanilla JS + Chart.js renders live charts from WebSocket messages |
hardware & wiring
The LSM6DS33 is a 6-axis IMU (accelerometer + gyroscope) from ST Microelectronics. It runs on 3.3V and communicates over I2C. Four wires to connect it to the Xiao ESP32-C3:
| LSM6DS33 | Xiao-ESP32-C3 |
|---|---|
| VCC | 3.3V |
| GND | GND |
| SCL | GPIO 7(D5) |
| SDA | GPIO 6(D4) |
In this week, I will be using the PCB I made in week 8. Since I am not using the jst connector, I will be using the direct pin connections. The only hurdle here is ensuring the correct pin assignments for SDA and SCL. On my board the pin D4 is part of female connectors while D5 is part of male connectors so I had to use different jumper cables to wire them.
This is what it looks like on the board:
.jpg)
Firmware
Uses the Adafruit LSM6DS Arduino library. Install it via Arduino IDE →
Sketch → Include Library → Manage Libraries → search "Adafruit LSM6DS" and install
along with its dependency "Adafruit Unified Sensor" when prompted. The library
abstracts all the I2C register reads — you just call getEvent() and get
clean float values back.
In setup() the sensor is initialised over I2C and configured — range sets
the maximum measurable value (±2G for accel, ±500°/s for gyro) and data rate sets how
fast the sensor samples internally (52Hz here). In loop(), getEvent()
fills three event structs with the latest accel, gyro and temperature readings. The six
motion values are then printed as a comma-separated line with println() —
the newline character at the end is what the Python backend uses as a message delimiter
to know a complete packet has arrived.
Adafruit_LSM6DS33 lsm;
void setup() {
Serial.begin(115200);
while (!Serial) delay(10);
if (!lsm.begin_I2C()) { Serial.println("ERROR"); while(1); }
lsm.setAccelRange(LSM6DS_ACCEL_RANGE_2_G);
lsm.setGyroRange(LSM6DS_GYRO_RANGE_500_DPS);
lsm.setAccelDataRate(LSM6DS_RATE_52_HZ);
lsm.setGyroDataRate(LSM6DS_RATE_52_HZ);
Serial.println("READY");
}
void loop() {
sensors_event_t accel, gyro, temp;
lsm.getEvent(&accel, &gyro, &temp);
// format: ax,ay,az,gx,gy,gz
Serial.print(accel.acceleration.x, 2); Serial.print(",");
Serial.print(accel.acceleration.y, 2); Serial.print(",");
Serial.print(accel.acceleration.z, 2); Serial.print(",");
Serial.print(gyro.gyro.x, 2); Serial.print(",");
Serial.print(gyro.gyro.y, 2); Serial.print(",");
Serial.println(gyro.gyro.z, 2);
delay(1000);
}
Python backend
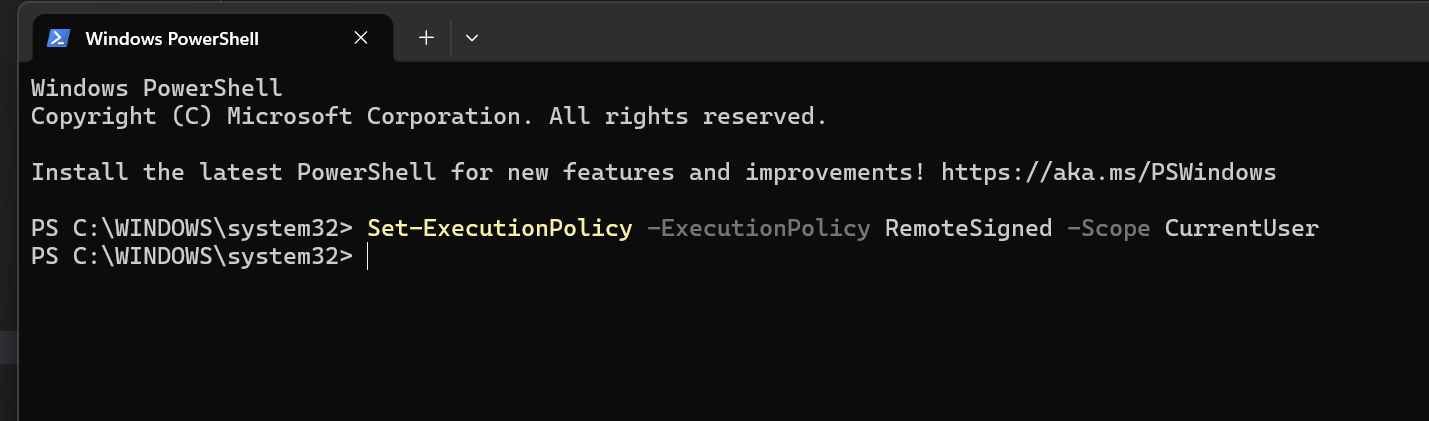
I am using visual studio code for this. So first I set up the virtual environment. As I was setting it up, it gave me an error saying running scripts was disabled. So I went to powershell and ran the commands shown in the picture after which the virtual environment was set up successfully.
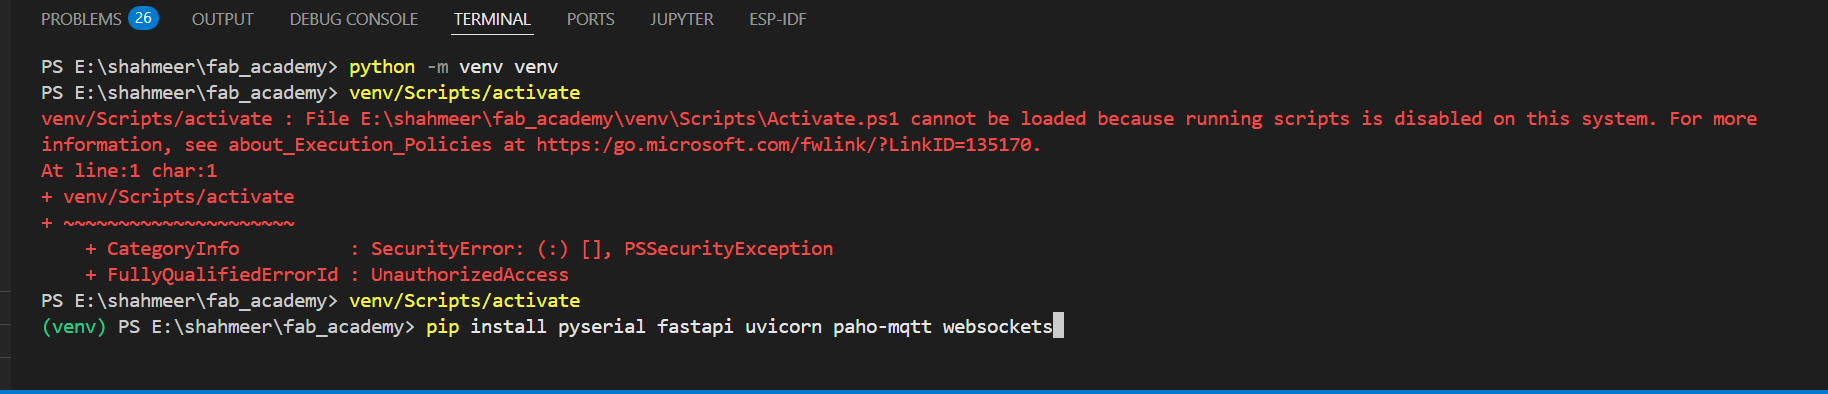
Afterwards, I installed the required dependencies for the Python backend.
The backend is a single backend.py file that acts as the bridge between
the ESP32 and the browser. It runs three things at once — a serial reader, an MQTT
publisher, and a WebSocket server. At the top of the file we import all the libraries
needed and set up three shared variables: clients (a list of connected
browser tabs), latest (the most recent sensor reading), and lock
(a threading lock that stops the serial thread and web server from reading and writing
to latest at the same moment).
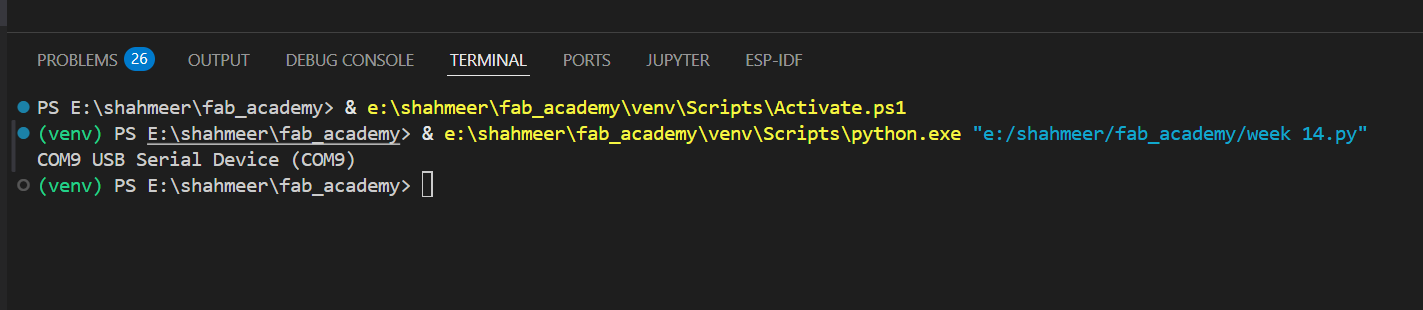
First I wrote the python code to see if the serial port is visible and being detected.
import serial.tools.list_ports

ports = serial.tools.list_ports.comports()
for p in ports:
    print(p.device, p.description)
Then I wanted to try reading data from the serial port to see if that is working. The first code I used had no exception handling so it gave an error.
    import serial

ser = serial.Serial('COM9', 115200, timeout=2)
while True:
    line = ser.readline().decode('utf-8').strip()
    if line:
        print(line)
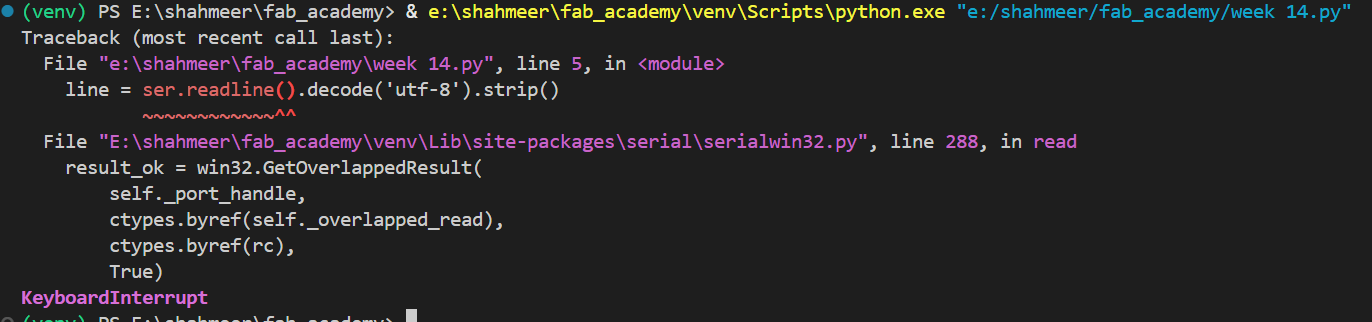
Then I added exception handling to the code and it worked fine after that. Here is the revised code:
import serial

try:
    ser = serial.Serial('COM9', 115200, timeout=2)
    print(f"Connected to {ser.port} at {ser.baudrate} baud")

    while True:
        line = ser.readline().decode('utf-8').strip()
        if line:
            print(line)

except serial.SerialException as e:
    print(f"Error: Could not open serial port - {e}")
except KeyboardInterrupt:
    print("\nConnection closed by user")
except Exception as e:
    print(f"Error: {e}")
finally:
    if 'ser' in locals() and ser.is_open:
        ser.close()
        print("Serial port closed")

Now after confirming the serial port was working and the data was being received, I moved on to actually reading the sensor data. I flashed the arduino code to the microcontroller and saw if it was working correctly. Then Implemented the following code in python to read and parse the IMU data. It was almost the same code as before so I am only gonna show the new lines added.
        try:
            ax, ay, az, gx, gy, gz = [float(x) for x in parts]
            print(f"accel: x={ax:.2f}  y={ay:.2f}  z={az:.2f}  |  gyro: x={gx:.2f}  y={gy:.2f}  z={gz:.2f}")
        except ValueError:
            continue
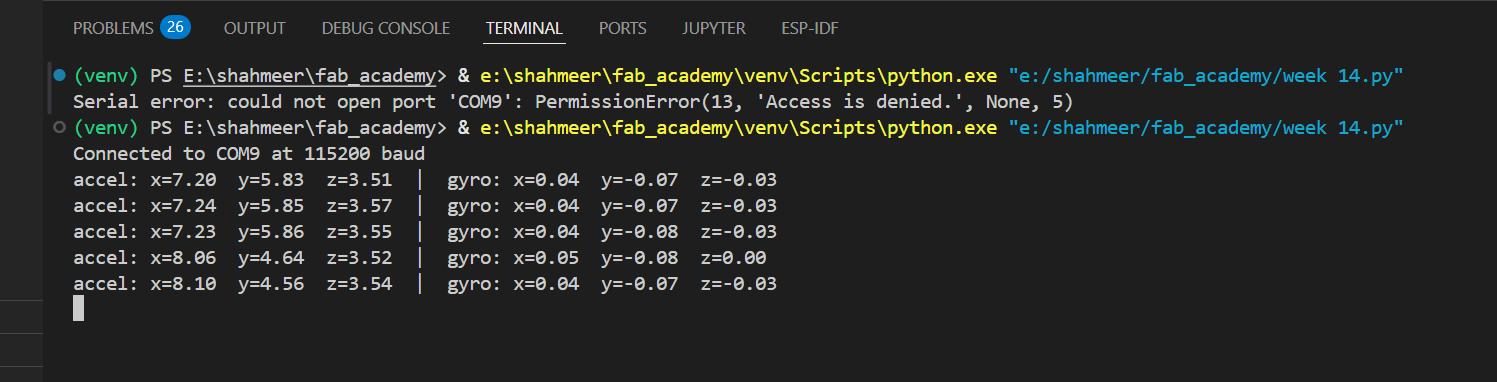
As can be seen, the sensor data is being read and parsed correctly. With the image showing the accelerometer and gyroscope values.
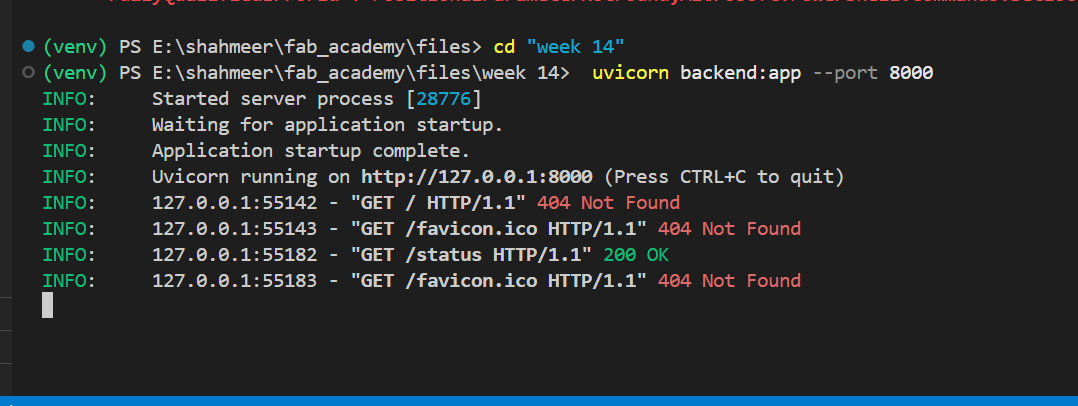
With serial reading confirmed working, the next step was building the actual backend
server. I used FastAPI — a Python web framework — served by
uvicorn, which is the actual process that listens for connections on
port 8000. You can't run FastAPI with just python backend.py because it
needs uvicorn to handle the networking. The command is always
uvicorn backend:app --port 8000 — this tells uvicorn to find the FastAPI
instance named app inside the file backend.py.
The backend does three things at once. A background thread runs the
serial reader continuously — it has to be a separate thread because serial reads are
blocking, meaning the code just sits and waits for the next line. If this ran on the
main thread the entire web server would freeze every time it waited for data. A
lock protects the shared latest dictionary — whenever
the serial thread writes to it or the web server reads from it, the lock is held so
they can never access it at the same moment and corrupt the data. The
/status route is a simple HTTP endpoint that returns whatever is
currently in latest as JSON — used to verify the pipeline was working
before adding WebSocket.
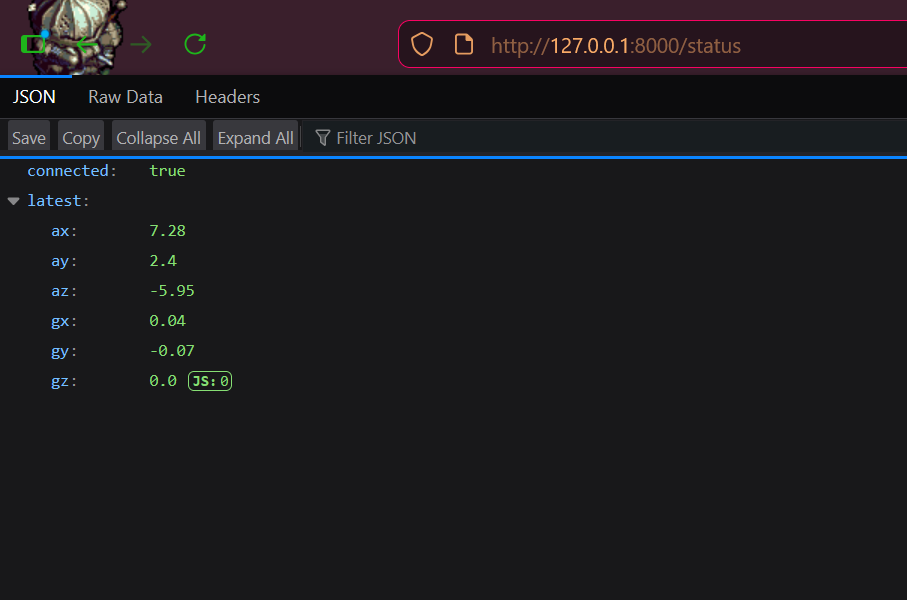
To test it I opened http://localhost:8000/status in the browser while
the ESP32C3 was connected. It returned connected: true with all 6 live
sensor values. Refreshing the page showed the values changing as I moved the sensor,
confirming the full serial → Python → HTTP pipeline was working.
WebSocket
A WebSocket is a communication protocol that keeps a permanent two-way connection open between the browser and the server. Unlike a normal HTTP request where the browser asks for data and the server responds then closes the connection, a WebSocket stays open the entire time — the server can push data to the browser whenever it wants without the browser having to ask. This makes it ideal for live data like sensor readings where you want the page to update the moment new data arrives rather than having to refresh.
I added a /ws WebSocket endpoint
to the backend. Every time a new browser tab connects it gets added to a
clients list. Each time the serial thread gets a new reading it broadcasts
the JSON to every client in that list simultaneously.
Before building the dashboard I wanted to confirm the WebSocket was actually working. I first ran the python file using uvicorn with the command uviconn backend:app --port 8000 which showed the following info:
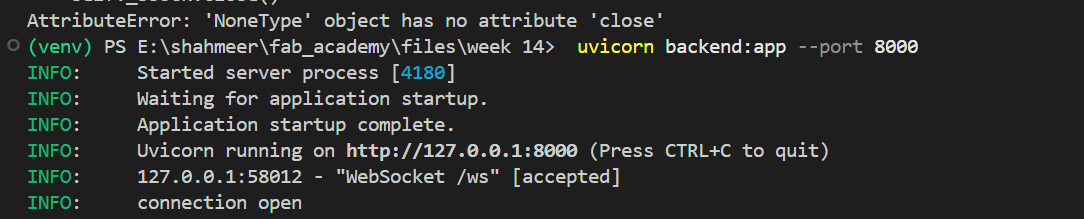
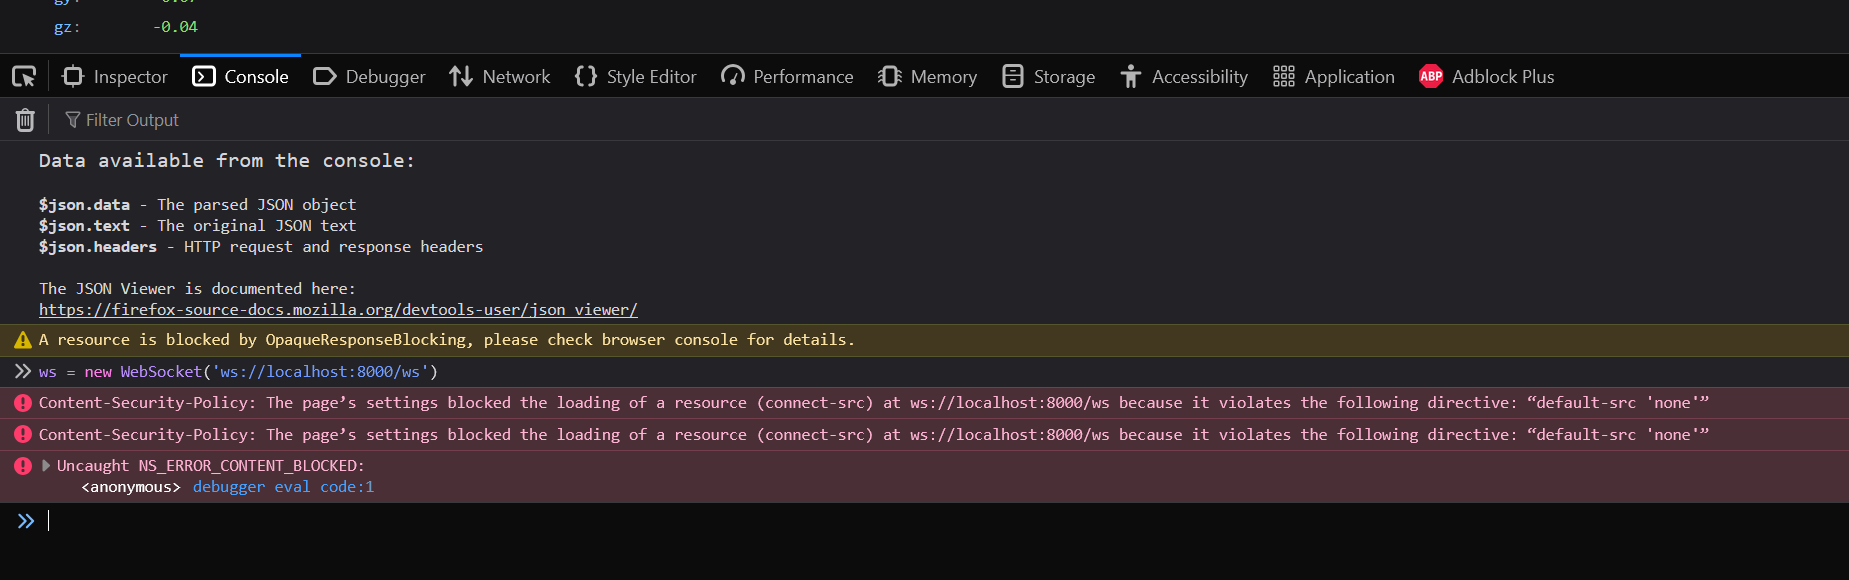
Then I clikced on the ip and opened up the webpage and also opened a blank tab in the browser, pressed F12 to open the developer console and typed in these two lines of JavaScript:
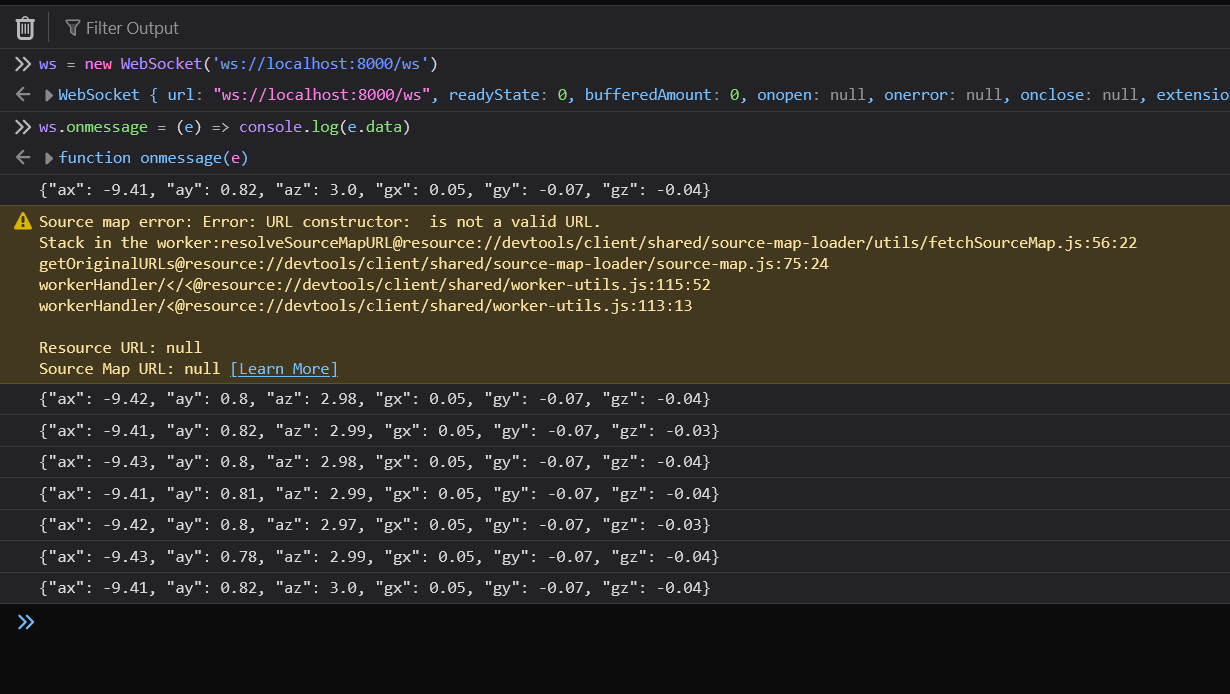
ws = new WebSocket('ws://localhost:8000/ws')
ws.onmessage = (e) => console.log(e.data)
The first attempt was on my Fab Academy page and it gave a Content Security Policy error blocking the connection.
Switching to an empty about:blank tab
fixed it. JSON packets started printing in the console automatically without any
refreshing, confirming the WebSocket was pushing data correctly.
Browser dashboard
With the backend sending data over WebSocket, the next step was building the actual page that displays it. The initial dashboard layout was made with the help of Claude — I gave it the WebSocket endpoint and the data structure, and it generated the page with the charts and live readouts. It is a plain HTML file with no heavy frameworks or build tools, just HTML, CSS, and vanilla JavaScript.
The page uses Chart.js for the historical data — two line charts, one for the accelerometer (X, Y, Z) and one for the gyroscope (X, Y, Z). Each chart keeps the last 80 data points and drops the oldest as new ones come in so it scrolls continuously. Above the charts are six number readouts showing the exact current value of each axis.
While the graphs were great for seeing raw data spikes, watching lines wiggle isn't the most intuitive way to understand physical orientation.
To fix this, I brought in Three.js to render a live 3D model right on the dashboard.
Because the backend only sends raw gravity vectors and rotational speeds, the frontend runs some basic trigonometry (Math.atan2) on the accelerometer data to calculate the pitch and roll angles on the fly, applying those directly to the 3D block's rotation.
The first time I opened the file by just double-clicking it, the dashboard loaded
but the charts were empty and the 3D scene wouldn't update. The
issue was that opening it as a local file (file:///) blocks WebSocket
connections for security reasons. The fix was to add a route in FastAPI that serves
the HTML file, then opening it at http://localhost:8000 instead.
Once I did that, the green connection dot appeared and everything synced up. Moving and shaking the sensor causes the chart lines to spike, while the 3D block physically tilts and rolls on the screen exactly as I move the board in my hand. Leaving it flat brings the cube level and the charts back to a stable baseline.
Here is a video of the dashboard in action:
Here is a video of both the sensor and the dashboard:
Reflection
This week was a deep dive into the software side of things — I had to build the entire stack from scratch and understand how each layer worked and talked to the next. It was a great learning experience that really solidified my understanding of how microcontrollers, serial communication, web servers and browsers all fit together. The most rewarding part was seeing the live charts update in real time as I moved the sensor around — it made all the coding and debugging worth it to see the data come alive on the screen.
 ← Back to Main Page